
Why Sellers Are Delisting Right Now (And Why That’s Not a Crash Signal)
You may be seeing headlines about a near-record number of homeowners pulling their homes off the market. If that has you wondering whether something bad is brewing, you’re not alone, it’s a natural reaction. When people start stepping back from a market, it can feel like they know something you don’t.
Here’s the more useful way to read it: this trend gets spun as a warning sign, but the actual data points to something far more mundane.
What’s Actually Behind the Delisting Numbers
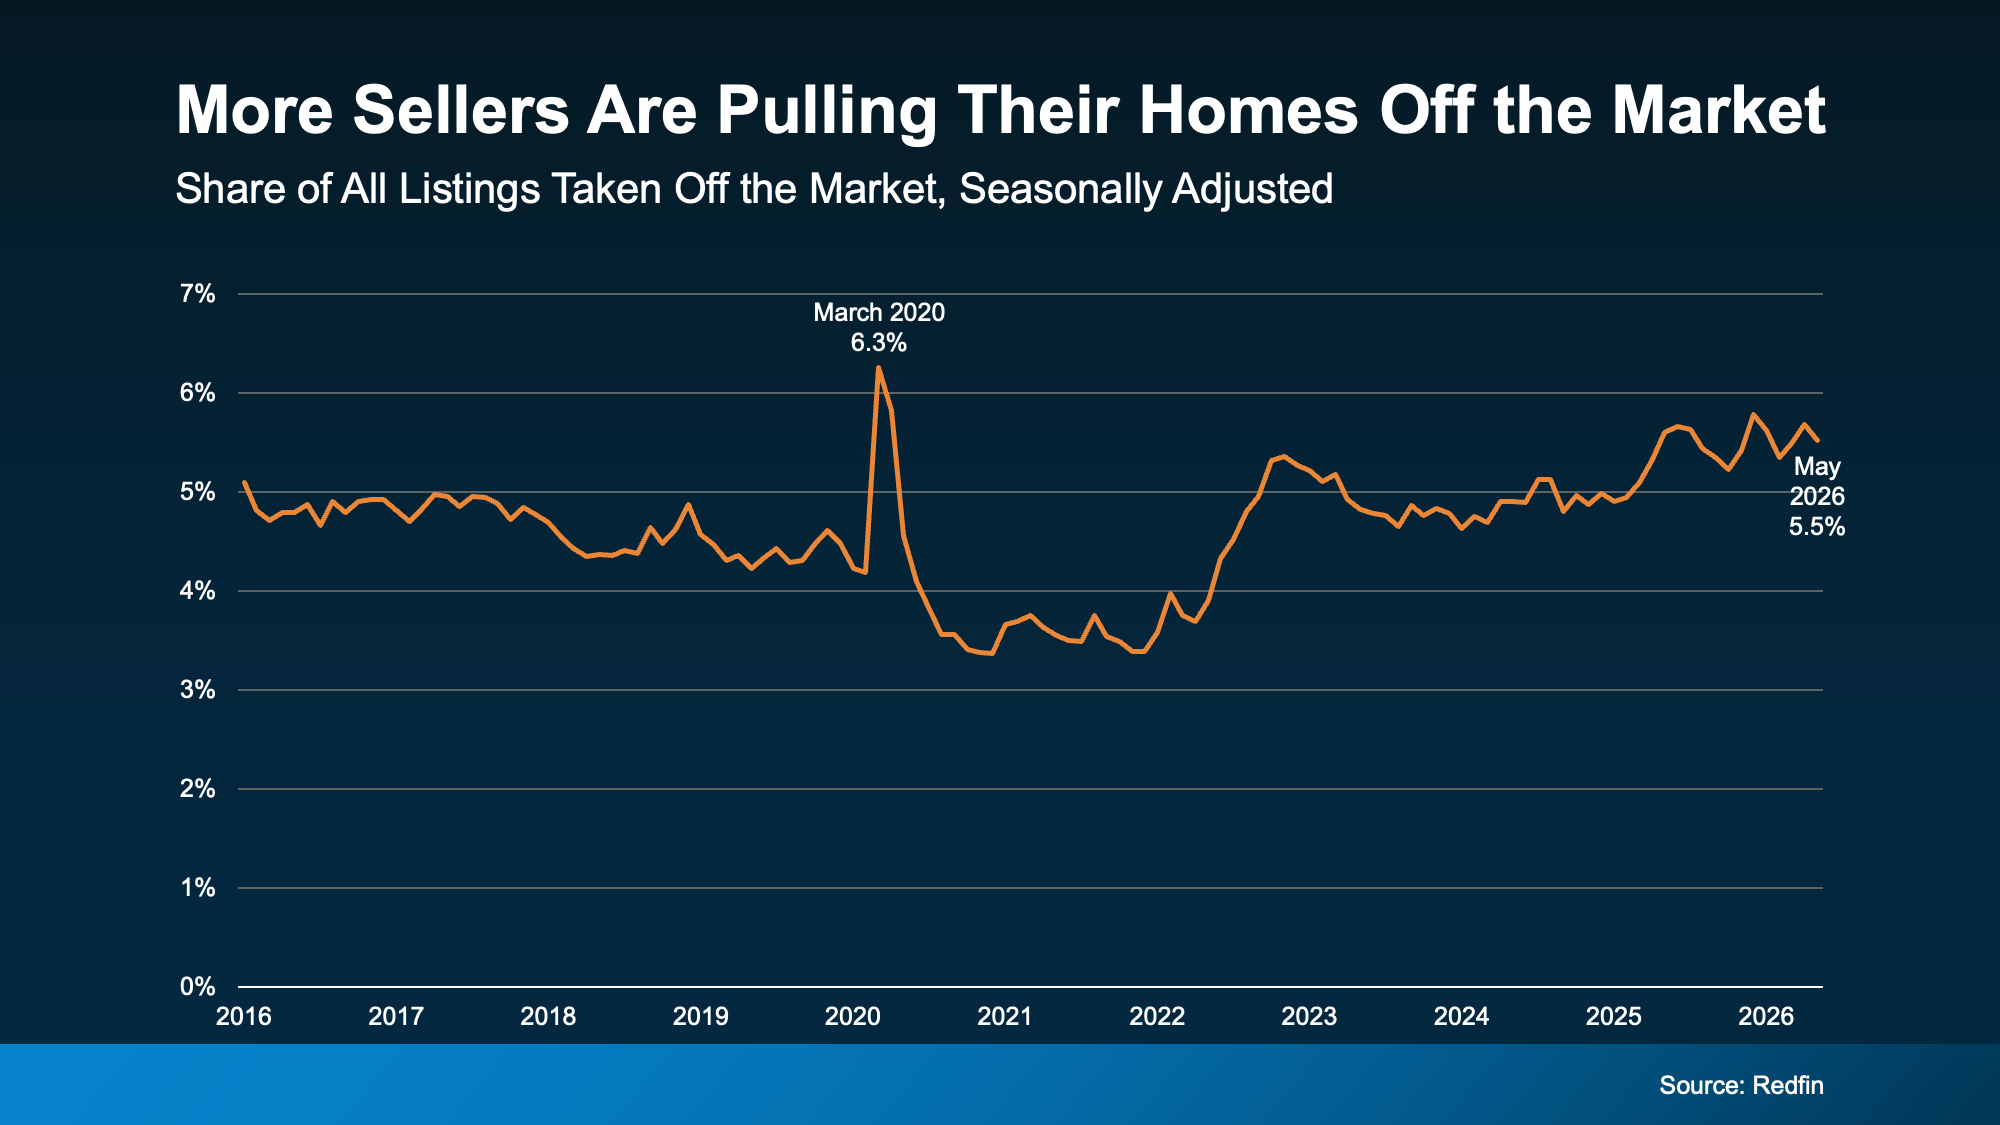
According to Redfin, 5.5% of all listings were pulled from the market in May, close to the highest share since March 2020. That headline travels well online precisely because it sounds alarming. But Redfin’s own breakdown of the reasons behind it tells a much less dramatic story. Four forces are driving this, and not one of them involves an impending price collapse.
Homes are simply taking longer to sell than they did a couple of years ago, and some sellers get frustrated with the slower pace and step back rather than wait it out. The number of homes for sale is growing faster than buyer demand in many areas, giving buyers more options and putting pressure on sellers who haven’t priced or prepared their home competitively. A meaningful share of sellers are still anchored to pandemic-era price expectations, and a number that would have worked in 2021 simply doesn’t match what today’s buyers are willing to pay, something we unpacked in detail in The Pricing Mistake That Could Cost You Your Sale. And broader economic uncertainty is making both sides more cautious, with buyers pausing and sellers second-guessing their timing.
Notice what’s absent from that list. Nowhere does Redfin point to a coming crash, and for the data on why that fear itself doesn’t hold up, see Think Home Prices Will Crash? Here’s What the Experts Actually Expect. This is a story about pace and competition, not collapse.
The Detail Most Headlines Skip Entirely
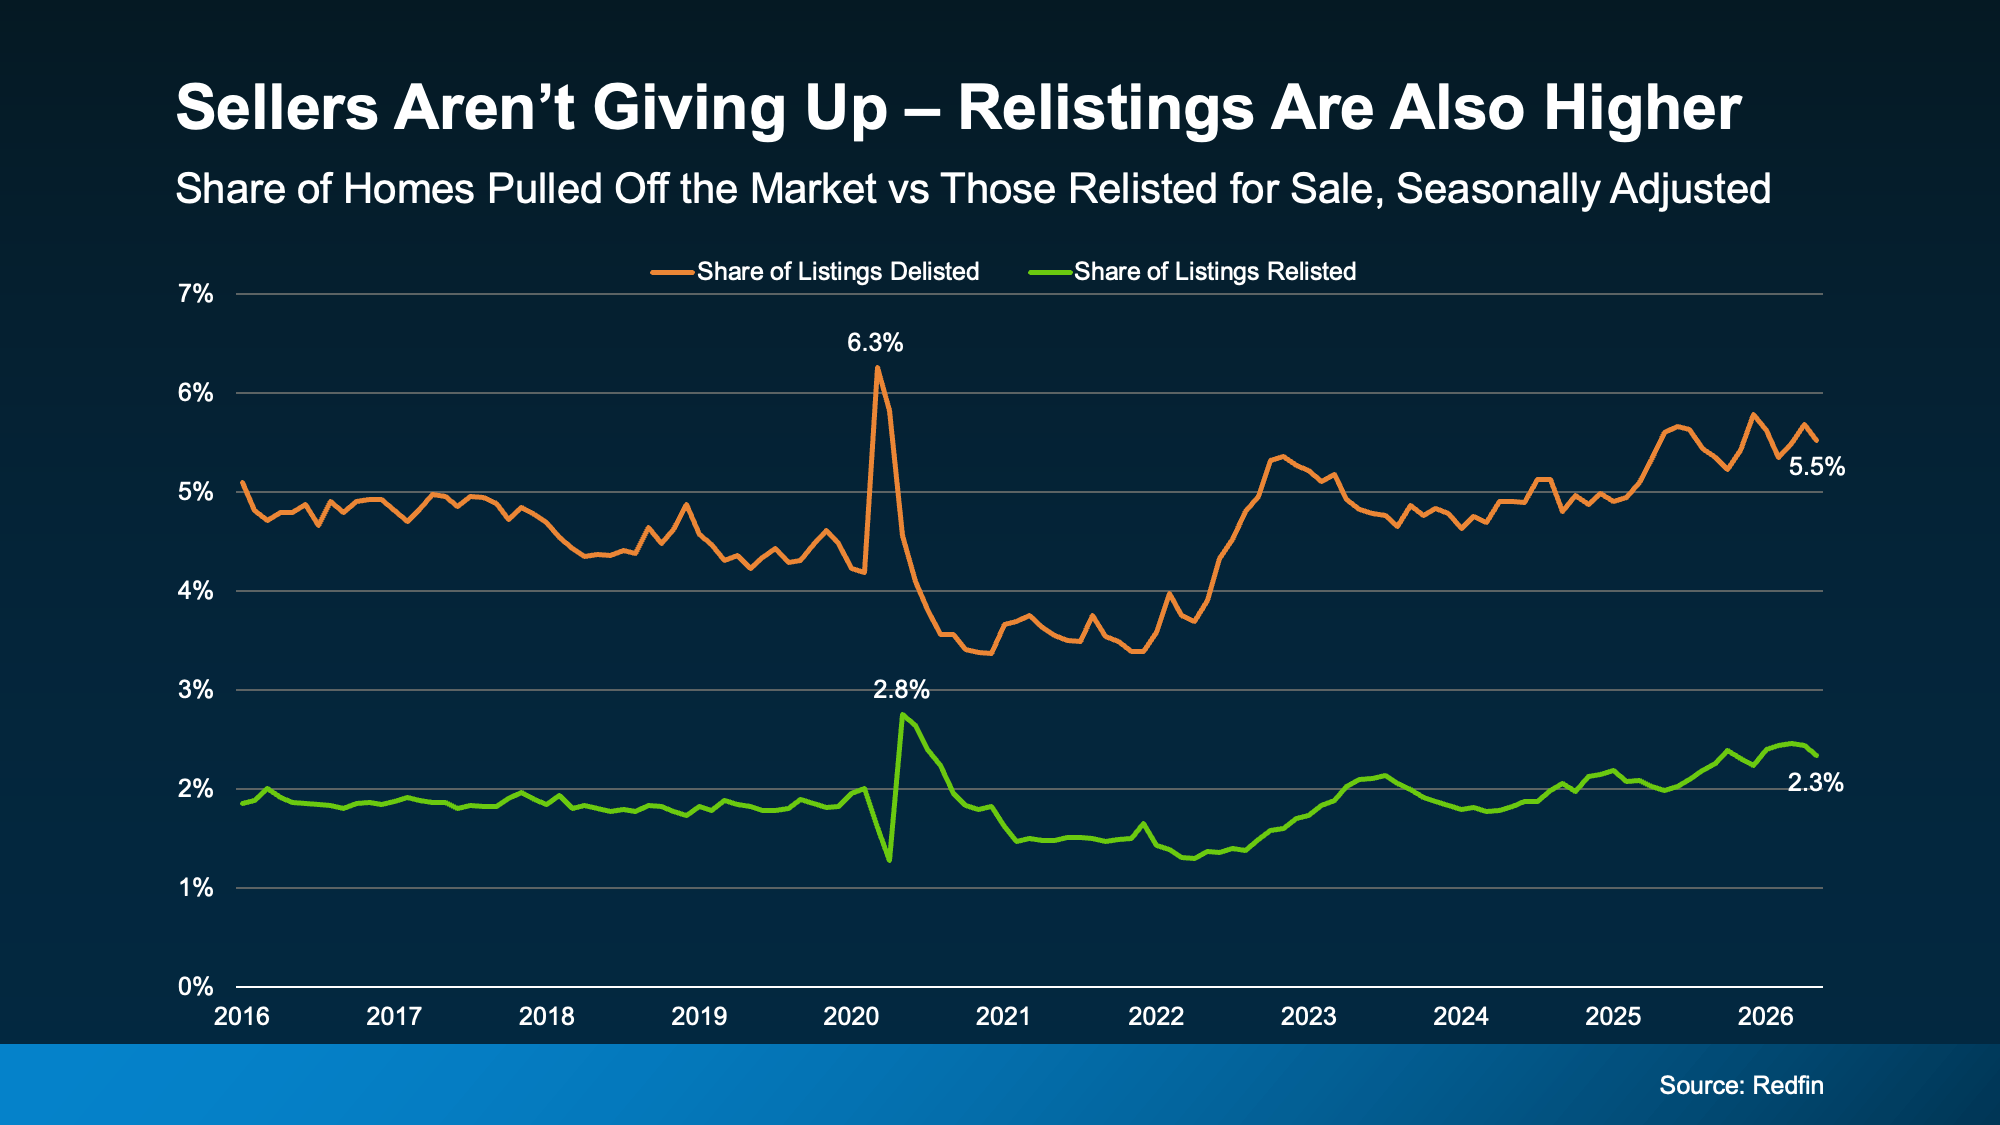
Here’s what actually puts the delisting number in perspective. While 5.5% of listings came off the market in May, Redfin’s data also shows 2.3% were put back on during that same stretch, the highest re-listing share since the pandemic began. Sellers pulling a home aren’t, in large numbers, giving up and walking away. Many are stepping back briefly to regroup before trying again with a different price, different photos, or different timing. That’s a pause, not a retreat, and often that single change in approach is exactly what finally gets the home sold.
Buyer Activity Is Actually Picking Back Up
If you want one more reason this isn’t a market in trouble, look at what’s happening on the demand side. NAR’s existing-home sales report shows sales rose 3.2% in May, the largest monthly increase since December, with NAR Chief Economist Lawrence Yun noting that more Americans are on the move as affordability continues to improve. As the Wall Street Journal described it, home sales in May posted the biggest rise this year, a sign the housing market’s crucial spring selling season may be showing signs of life after a sluggish start. That is not the language you’d expect to describe a market sliding toward trouble.
One Honest Caveat Worth Knowing
Here’s the nuance the national headline glosses over, and it matters specifically for our region. NAR’s same report shows sales actually fell 8.0% year-over-year in the Northeast even as the national figure rose, while the South, Midwest, and West all posted gains. That regional divergence is a real pattern, not a contradiction, and it’s a good reminder that a national delisting or sales statistic doesn’t automatically describe what’s happening in Camden County. It’s exactly why local data matters more than the headline.
What This Means for Buyers and Sellers in South Jersey
The Northeast’s softer year-over-year sales pace doesn’t mean our local market mirrors the national delisting trend one-to-one. According to Zillow’s Home Value Index, Camden County values are still up 4.9% over the past year with homes going to pending in around 18 days, a pace that doesn’t suggest sellers here are stepping back out of panic. Our South Jersey Real Estate Market Update 2026 breaks down exactly how Camden, Burlington, Gloucester, and Salem counties are each performing right now, which is far more useful than extrapolating from a national delisting headline.
If you’re a seller who has been considering pulling your listing out of frustration, that decision deserves a real conversation about whether the issue is pricing, presentation, or simply timing, not a reaction to a scary headline. And if you’re a buyer reading delisting numbers as a sign to wait, the data suggests the opposite: demand is picking back up, not fading.
Reach out to the MH Global team. Whether you’re thinking about pulling a listing, relisting with a new strategy, or wondering what any of this means for your specific search, let’s look at what’s actually happening in your market.