
Why Home Prices Are Rising in Some Markets and Falling in Others Right Now
You have probably seen two completely different stories about home prices in the same week. One article says prices are climbing. Another says they are declining. Both can be true at the same time, and understanding why is the most useful thing you can do before making a buying or selling decision right now.
The National Average Is Hiding Two Very Different Markets
Here is the honest picture at the national level. According to ResiClub’s analysis of the Zillow Home Value Index, U.S. home prices are up just 0.8% year-over-year between March 2025 and March 2026. That is a soft number. But it is an average of two genuinely different stories happening simultaneously across the country.
Of the nation’s 300 largest housing markets, 89 are currently seeing year-over-year price declines. The other 211 are still seeing prices rise. That split tells you why a single national headline almost always misleads: it averages together places that are behaving very differently and produces a number that accurately describes almost nowhere specifically.
The question that actually matters for your situation is which camp your market falls into and why.
The Single Biggest Driver Is Supply
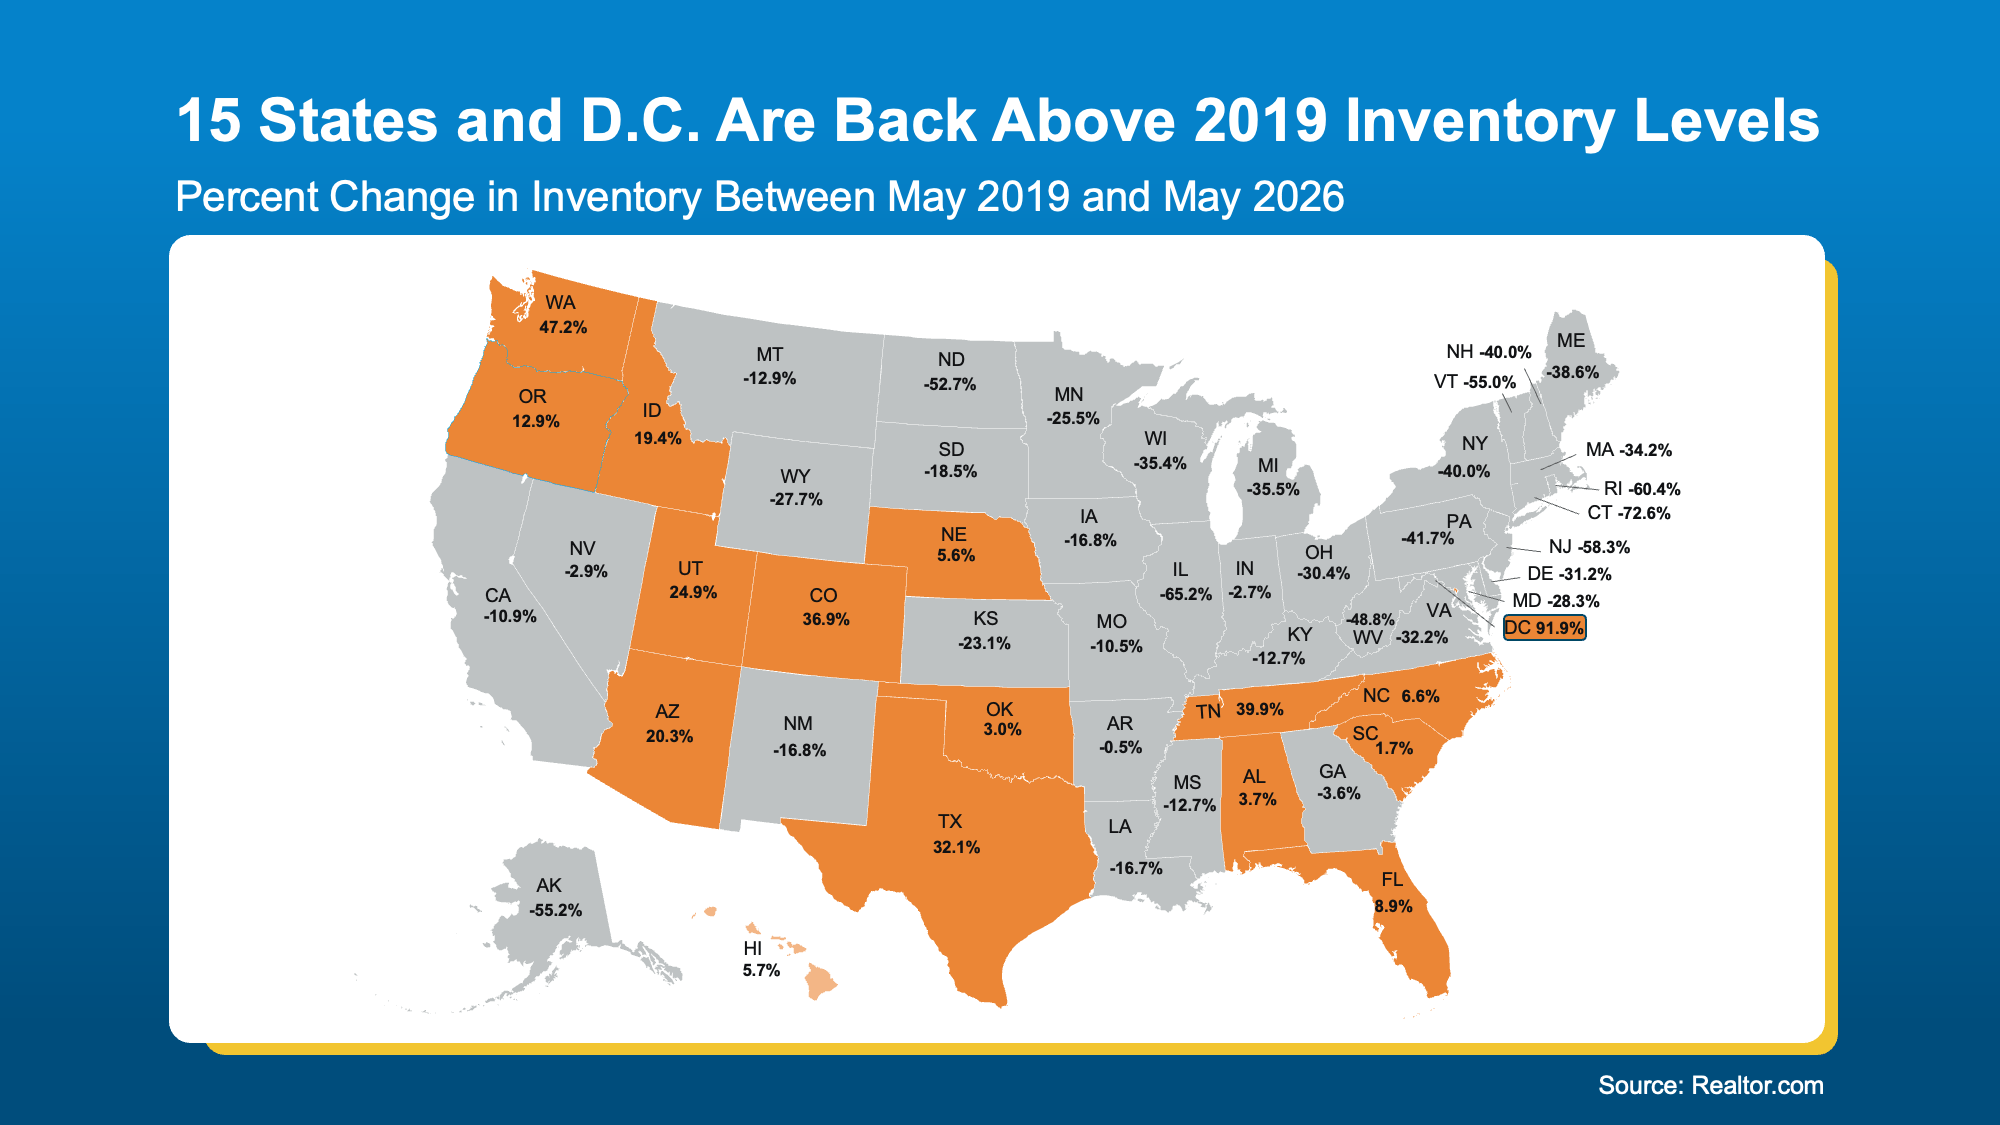
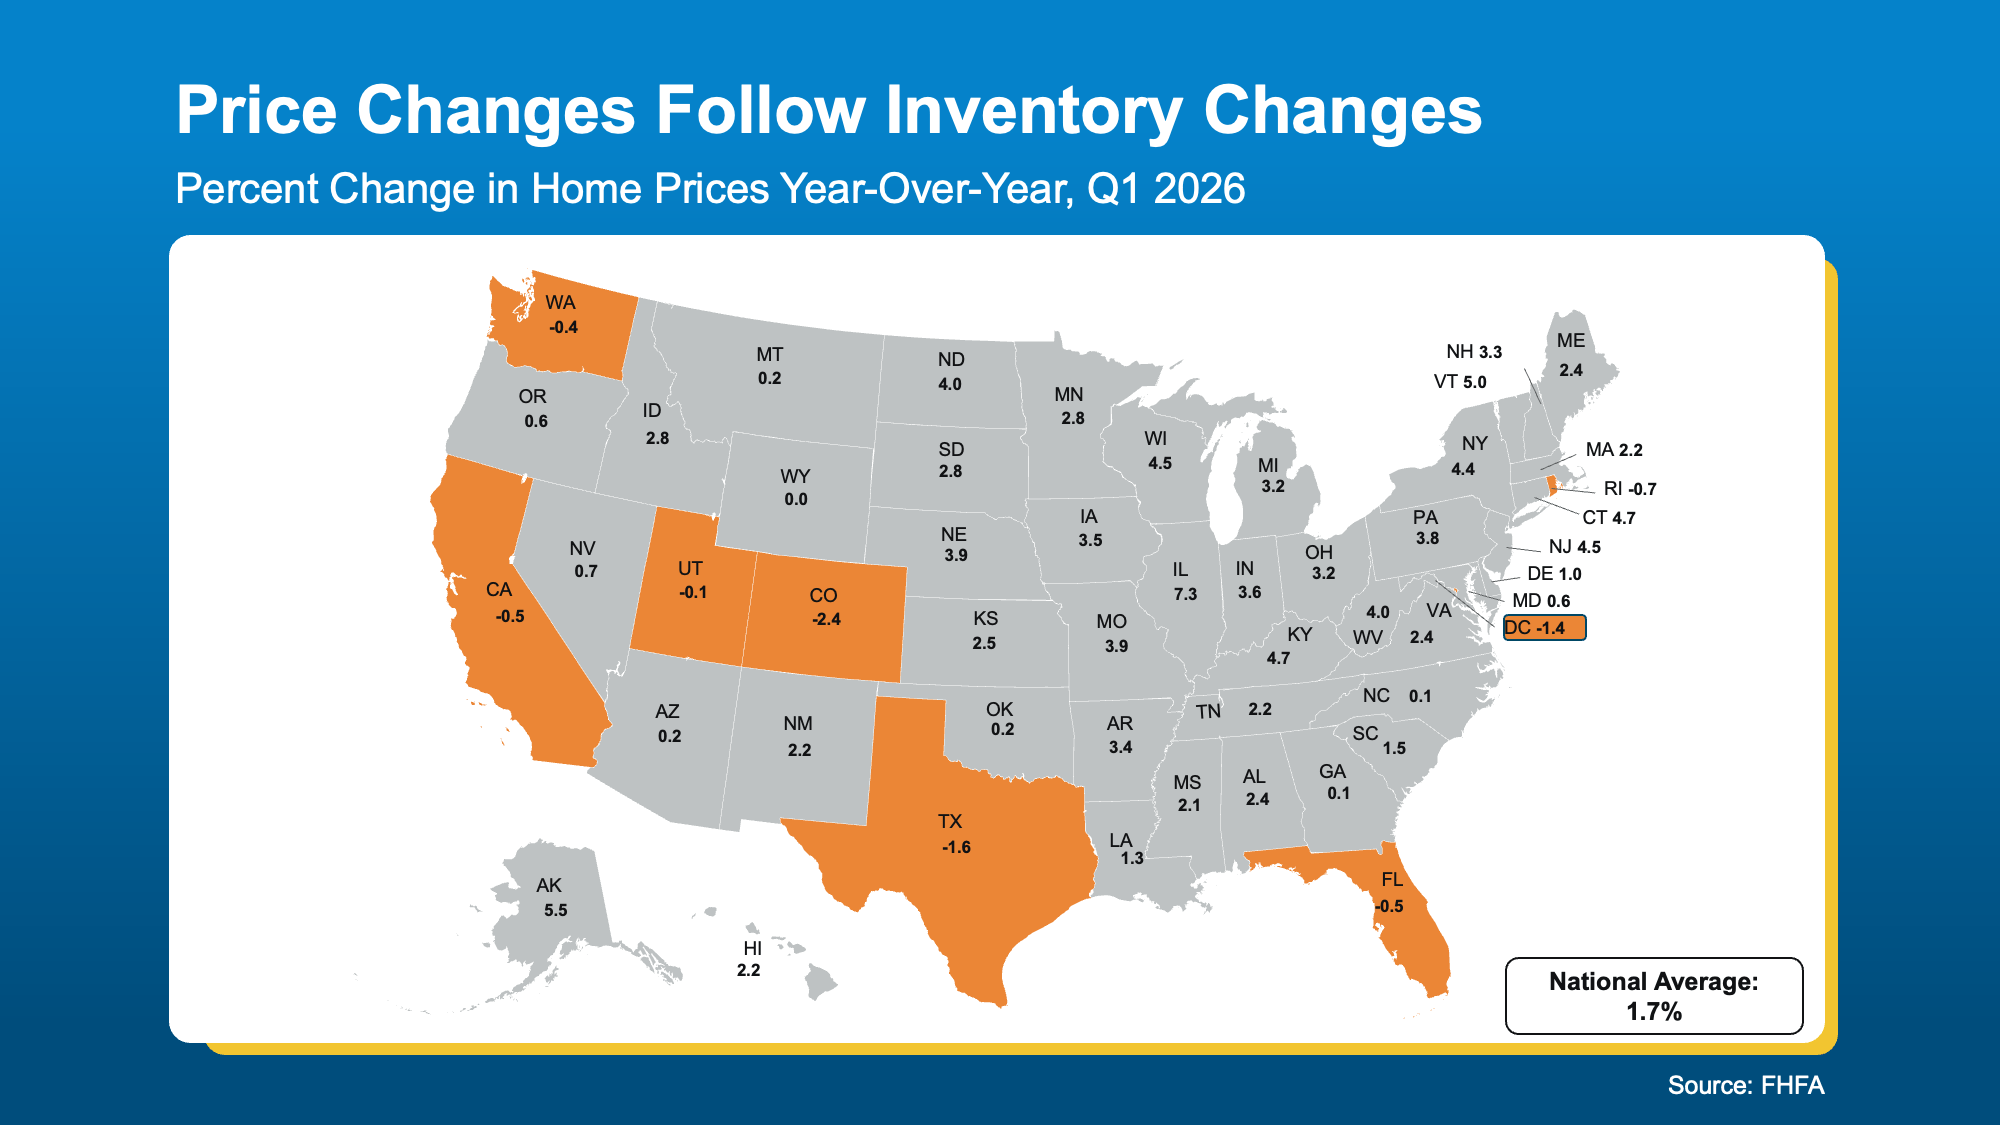
The mechanism behind all of this is straightforward once you see it. Markets where active inventory has climbed back to or above pre-pandemic 2019 levels are seeing prices flatten or fall. Markets where inventory is still well below those 2019 benchmarks are still seeing prices rise. As Lance Lambert, CEO of ResiClub, explains it directly:
Home prices are still climbing year-over-year in many regions where active inventory remains well below pre-pandemic 2019 levels, such as pockets of the Northeast and Midwest. In contrast, some pockets in states like Texas, Florida, and Colorado, where active inventory exceeds pre-pandemic 2019 levels by a solid clip, are seeing modest home price pullbacks or flat pricing.
That is cause and effect, not coincidence. When buyers have more options, competition drops and sellers lose pricing power. When supply stays tight, competition stays elevated and prices hold or rise. The FHFA House Price Index dataconfirms this pattern when you map it against Realtor.com’s active inventory data by state: the states where inventory has recovered fastest are the states where prices have softened most, and the overlap is precise.
Why Sun Belt Markets Are Softening
The markets seeing the most pronounced softening are concentrated in the Gulf Coast and Mountain West regions, particularly Austin, Tampa, and parts of Colorado and Florida. The ResiClub data puts the Austin market in stark perspective: home prices there now sit 27.8% below their 2022 peak. These were also the markets that surged the most dramatically during the pandemic buying frenzy, which means part of what is happening is straightforward mean reversion after prices ran well ahead of what local incomes could sustainably support.
The softening was compounded by a construction boom. Builders responded to pandemic-era demand by building aggressively in Sun Belt markets. That supply wave is now working through the market, giving buyers more options and reducing the urgency that drove bidding wars. Builders willing to cut prices or offer incentives to move inventory, as we covered in Newly Built Home Prices Hit a 5-Year Low, have also put downward pressure on resale prices in those same markets.
Why Northeast and Midwest Markets Are Holding
The Northeast and Midwest tell a different story. These regions did not see the same construction surge, so inventory has remained constrained relative to demand. The Hartford, Connecticut metro, for example, now sits 22.5% above its 2022 peak, the precise opposite trajectory of Austin. Supply never came and prices have continued to climb.
This is directly relevant to our market. South Jersey and the greater Philadelphia region sit squarely in the Northeast pattern. As we detailed in our South Jersey Real Estate Market Update 2026, Camden County home values are up 4.9% over the past year with homes going to pending in around 18 days. Gloucester County saw a 14% single-family median price surge in the first quarter. These are not markets softening under supply pressure. They are markets where demand consistently exceeds what is available, which is exactly the dynamic the national data predicts for low-inventory regions.
The Decline Count Is Actually Stabilizing
One more piece of context worth having: the number of markets seeing year-over-year price declines peaked at 110 in June 2025 and has been decreasing since. By March 2026 it was down to 89. ResiClub expects that number to decline further in coming months as seasonal activity picks up and inventory growth has decelerated from its fastest pace. This is not a picture of deterioration accelerating. It is a picture of bifurcation that has already peaked and is beginning to narrow.
For buyers who are worried about falling prices, Think Home Prices Will Crash? Here’s What the Experts Actually Expect addresses this directly. And for the bigger-picture view on why the structural conditions for a 2008-style collapse are simply not present, What the Foreclosure Headlines Aren’t Telling You covers the equity and lending picture in detail.
What This Means If You Are Buying
If you are shopping in a Sun Belt market with elevated inventory, you genuinely have negotiating leverage right now: more choices, less competition, sellers more open to concessions on price and closing costs. If you are shopping in the Northeast, including South Jersey, you are still in a competitive environment where correctly priced, well-presented homes move quickly and multiple-offer situations still happen in desirable neighborhoods. Strategy needs to match market reality, which we covered in 4 Ways To Give Your Offer an Edge This Spring.
What This Means If You Are Selling
Pricing strategy is everything right now, and it is different depending on your specific market. In areas where inventory has risen meaningfully, overpricing is the fastest path to sitting unsold and eventually taking a larger price cut than you would have with a correct price from day one. We unpacked exactly why in The Pricing Mistake That Could Cost You Your Sale. In markets where inventory is still tight, you are in a stronger position, but even there, correct pricing from day one is what generates the competitive offers that maximize your outcome.
What This Means Right Here in South Jersey
The national price bifurcation is real but it is not our story. South Jersey’s supply picture keeps us firmly in the appreciating camp, and the data backs that up across every county we cover. The buyers and sellers who navigate this market successfully are the ones who stop reading the national average as if it describes their street and start looking at what is actually happening in their zip code.
Reach out to the MH Global team. Let’s look at exactly where your specific neighborhood sits in this data and build a strategy around what is actually happening in your market right now.