
Will Home Prices Crash? Here Is What the Data Actually Shows
If you are holding off on buying because you think a crash is coming, you are not alone. It is one of the most common reasons buyers give for waiting right now. The question is whether that belief holds up against the actual data, or whether it is mostly a product of which headlines get clicked.
Most of the Country Is Still Seeing Prices Rise
Start with the basic fact pattern. Realtor.com data shows home prices are currently rising in 71% of markets nationwide.Roughly three out of every four markets in the country are appreciating right now, not declining. The minority of markets seeing price softness get a disproportionate share of media coverage because negative stories perform better online than steady, unremarkable growth. That creates a distorted impression that prices are falling broadly when the data says the opposite.
This matters because the decision to wait is usually based on a belief about the national picture, not a belief about your specific zip code. If that national belief is wrong, the decision built on it is wrong too.
What 100+ Economists Actually Forecast
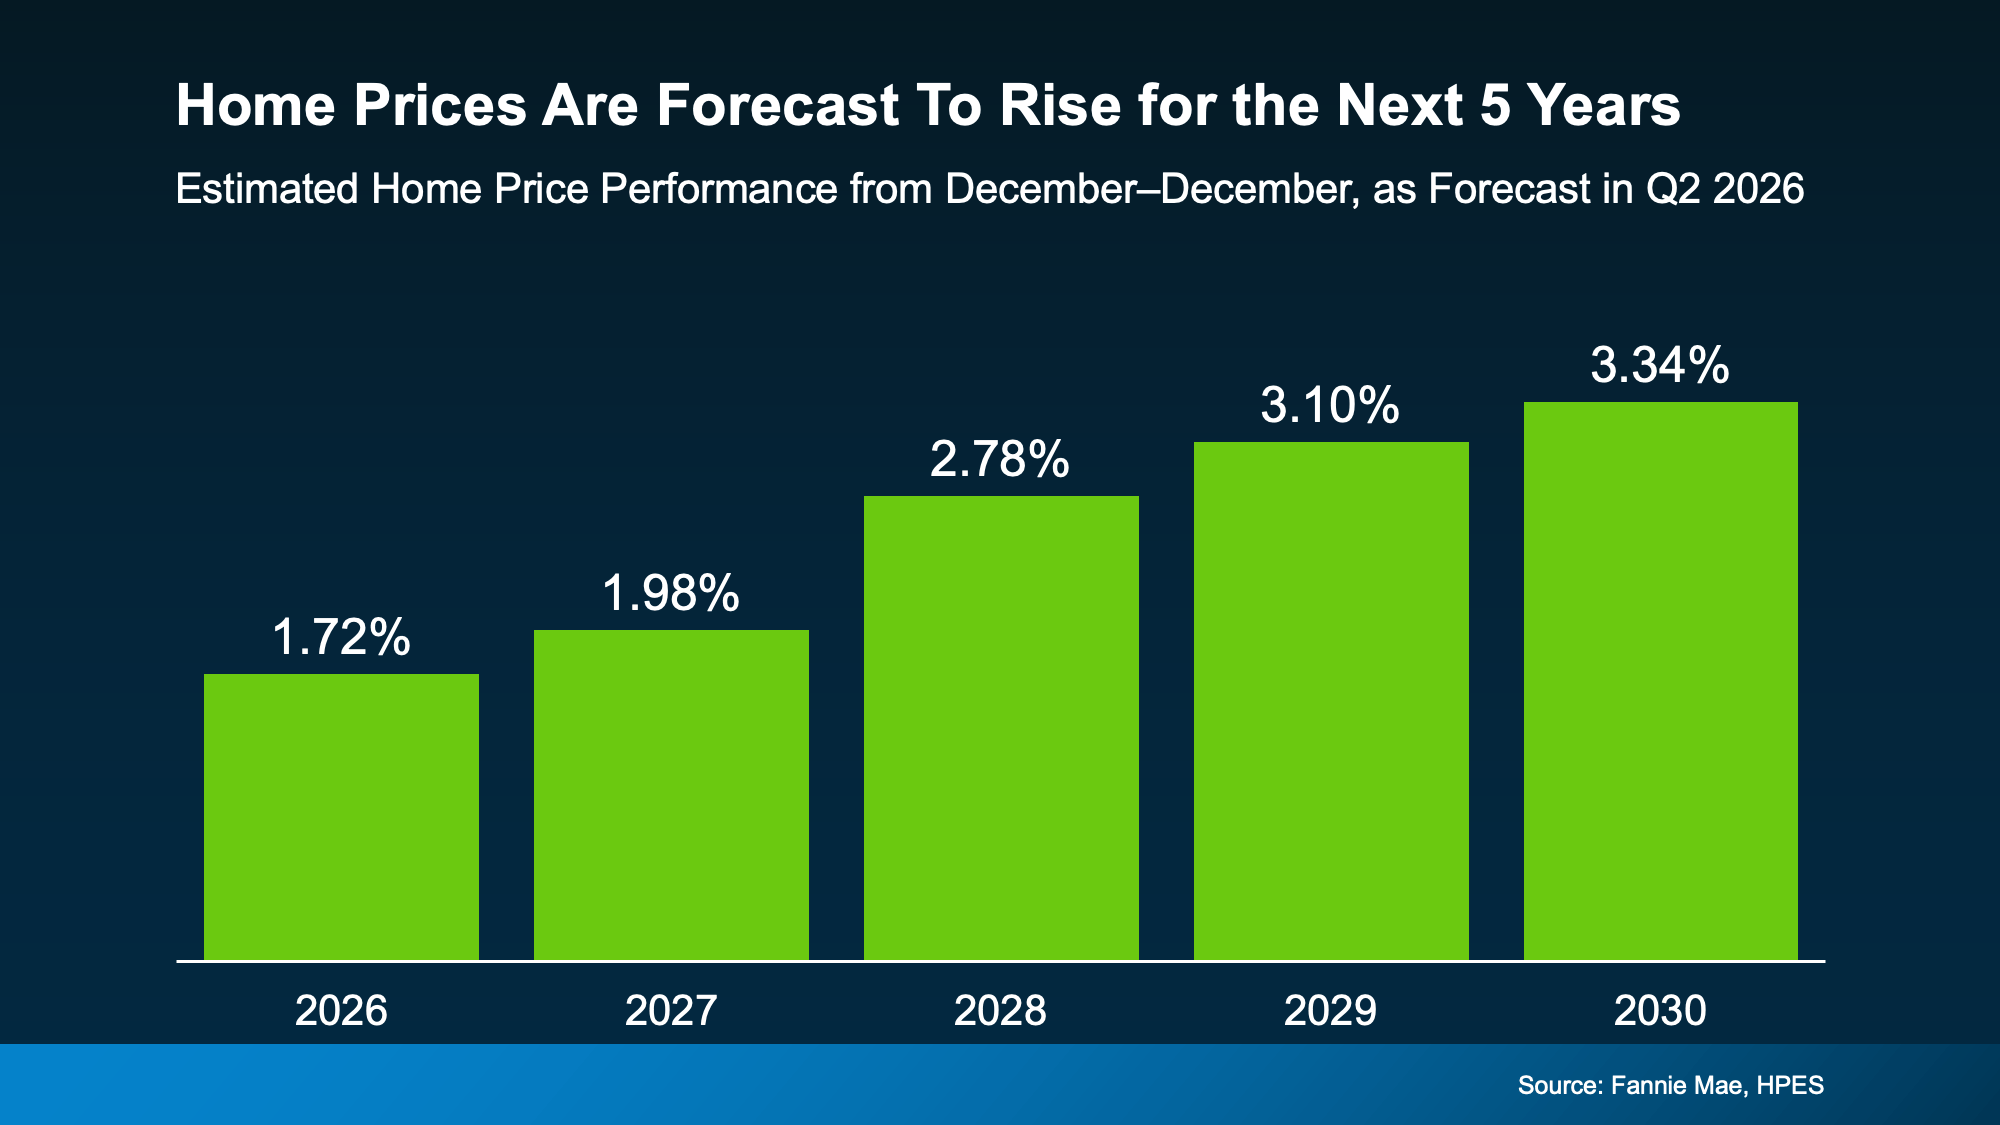
Rather than relying on social media sentiment, look at what professional forecasters are projecting. The Fannie Mae Home Price Expectations Survey polls more than 100 economists and housing analysts every quarter and asks them directly where prices are headed. The panel is split into optimists and pessimists specifically so the survey cannot be accused of cherry-picking only bullish voices.
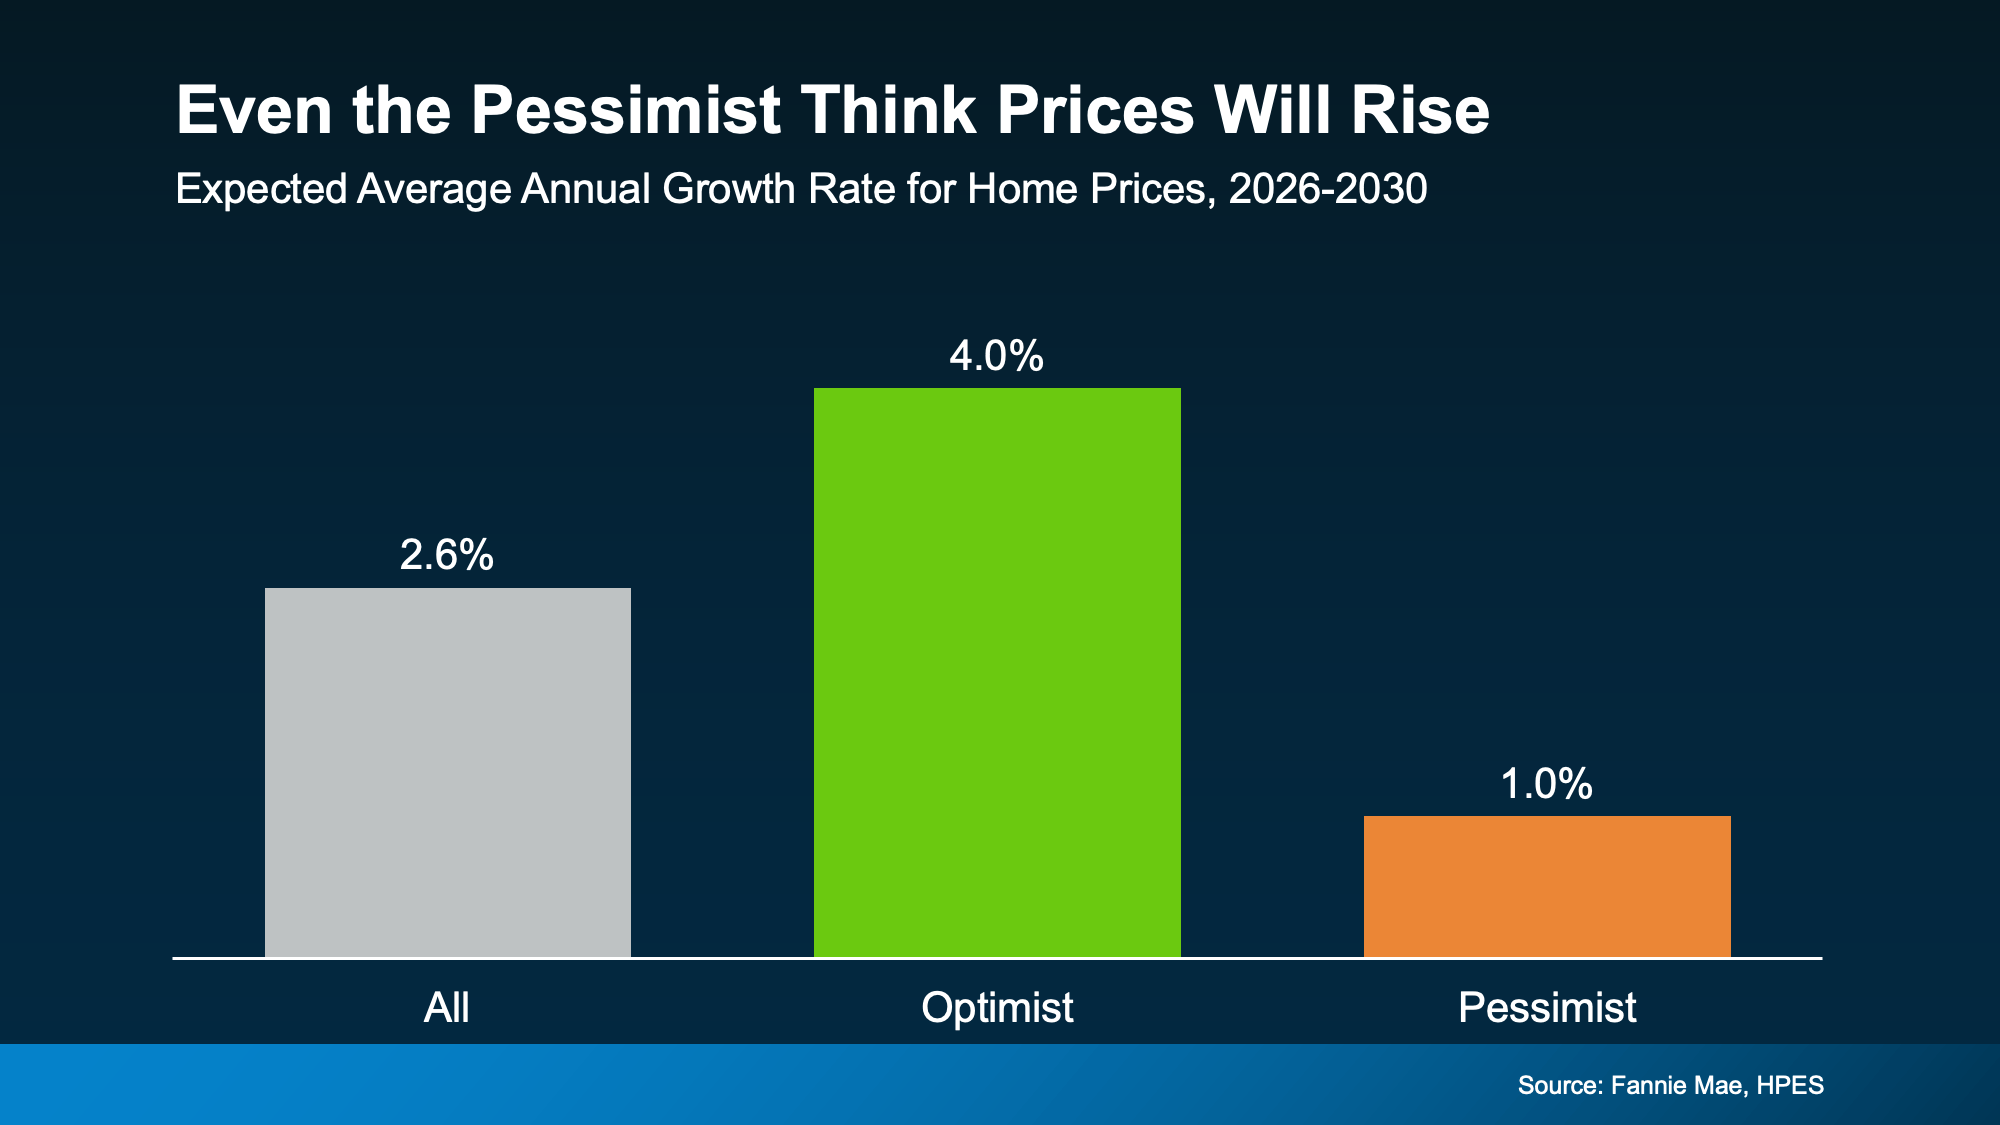
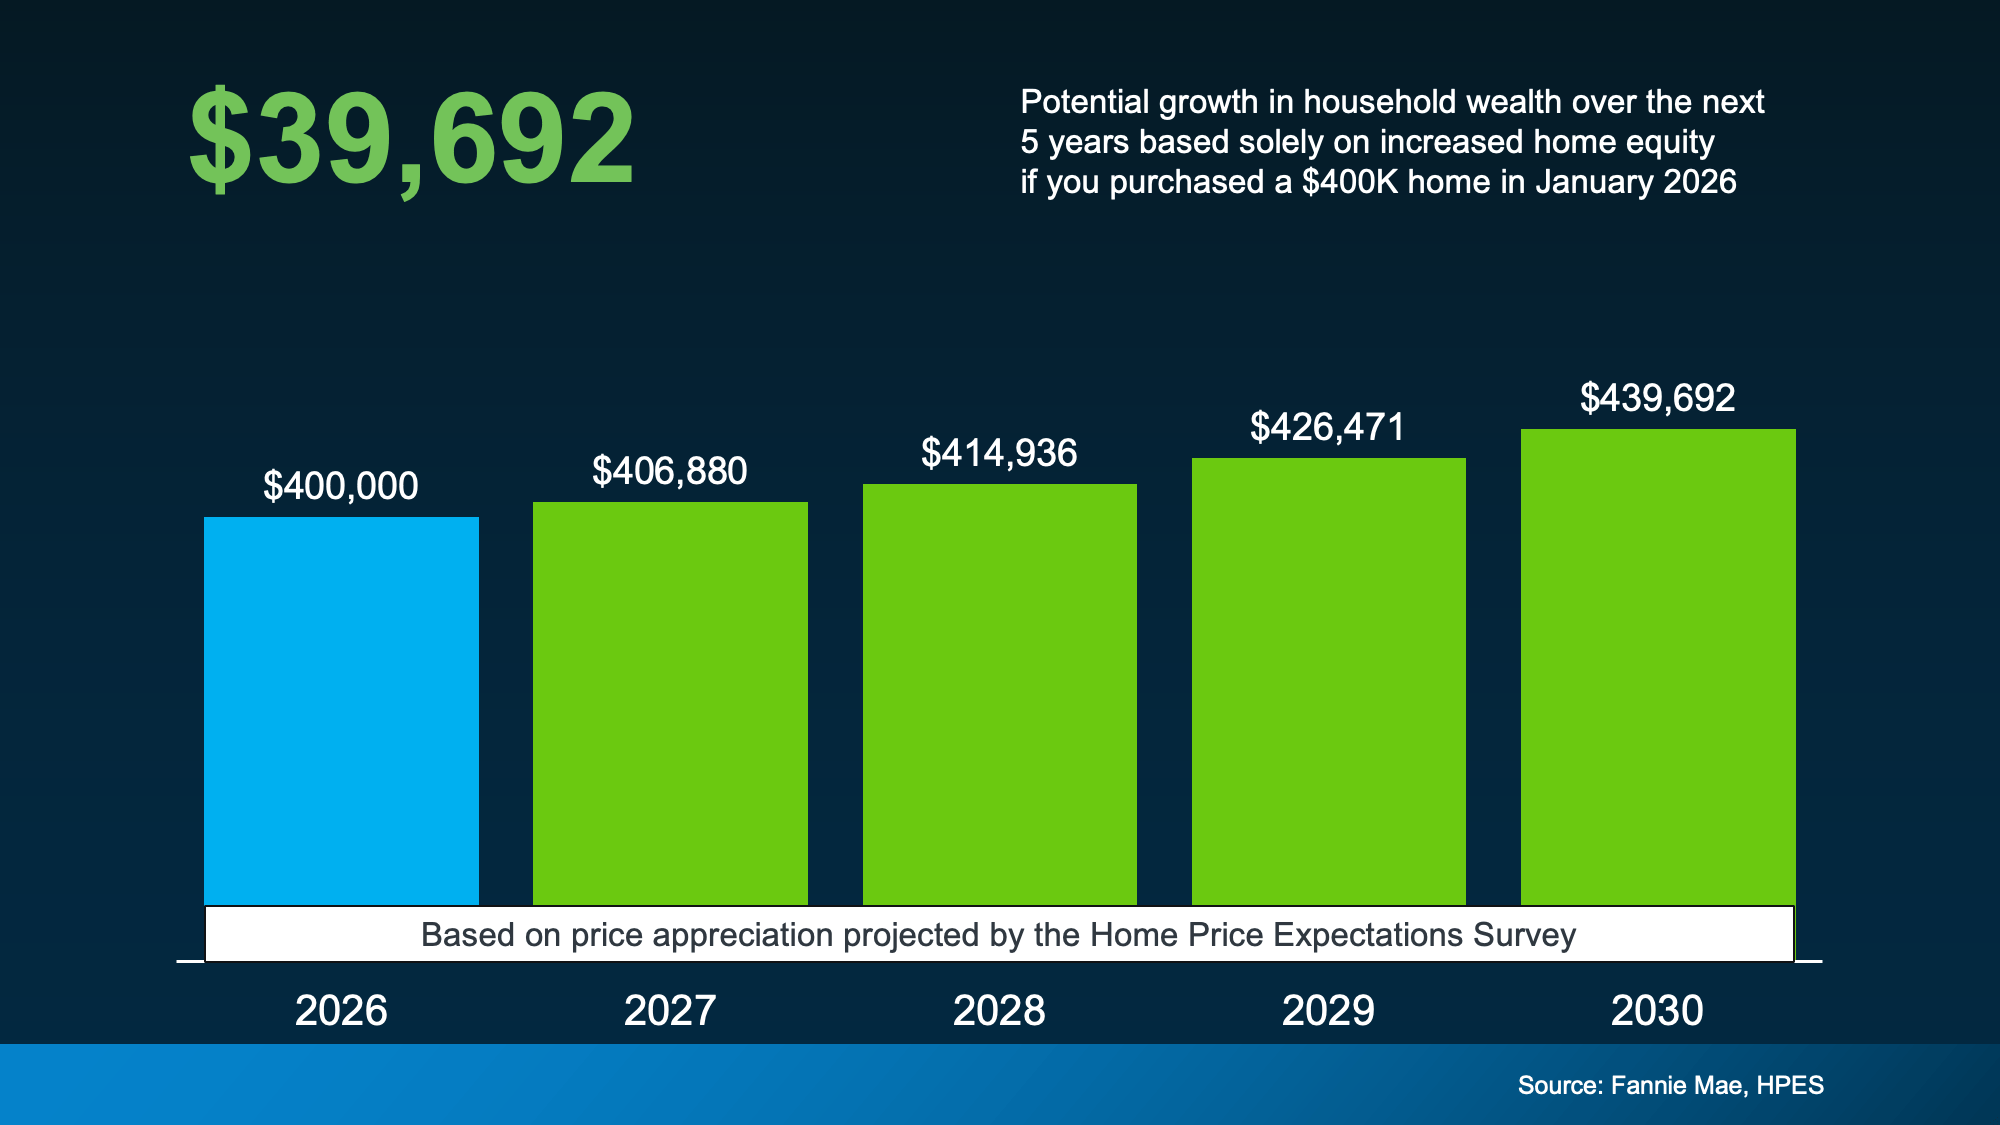
The result across both camps: nobody in the survey is forecasting a crash. The optimistic group expects roughly 4% annual appreciation over the next five years. The pessimistic group, the ones actively looking for reasons prices might struggle, still expects about 1% annual growth. Zero percent of the professional consensus points toward decline. The actual disagreement among experts is about the pace of growth, not its direction.
That is a meaningfully different conversation than what circulates in comment sections and short-form video predictions, and it is worth anchoring your decision to the version backed by data rather than the version optimized for attention.
The Real Cost of Waiting for a Crash That Does Not Come
Here is where the math becomes concrete. If the HPES forecast holds, a buyer purchasing a $400,000 home today would gain close to $40,000 in equity over the next five years from appreciation alone, separate from anything they pay down on the loan itself. That is the national average, and your specific market will vary, but it illustrates the scale of what is potentially given up by waiting on a decline that the data does not support.
Flip that around and the risk becomes clearer. A buyer who waits five years hoping for a crash, and instead sees the typical forecasted appreciation, is not just missing equity gains. They could end up paying tens of thousands more for the same home later, financed at whatever rate exists at that point. Waiting is not a neutral, risk-free choice. It carries its own cost, one that rarely gets weighed against the risk people are trying to avoid.
Why This Fear Persists Anyway
If the data is this consistent, why does the crash narrative keep circulating? Part of it is recency bias from 2008, an event that genuinely reshaped how an entire generation thinks about housing risk. Part of it is that algorithm-driven platforms reward alarming claims regardless of accuracy. And part of it is that a small number of markets really are softening, which gives the narrative just enough truth to feel credible even though it does not generalize.
We unpacked a related set of these misconceptions, around inventory and sales pace specifically, in 3 Things That Are Not Going To Happen in Today’s Housing Market. The pattern across all of these fears is the same: a real but narrow data point gets generalized into a sweeping, inaccurate claim. Homeowner equity nationally is also near record levels, which is part of why a 2008-style collapse is not structurally possible right now. We go deeper on that specific point in Record High Mortgage Debt Sounds Scary. Here’s What the Headlines Leave Out.
What the Forecast Means for Buyers in South Jersey
The national projection lines up with what is actually happening locally. Zillow’s Home Value Index shows Camden County home values up 4.9% over the past year, sitting comfortably inside the range the HPES panel projects nationally for the next five years. That is not a market bracing for a correction. It is a market appreciating at a normal, sustainable pace, exactly the scenario the forecasters describe. For the broader county-by-county breakdown, our South Jersey Real Estate Market Update 2026 lays out what is happening across Camden, Burlington, Gloucester, and Salem counties right now.
If a potential crash is the only thing keeping you on the sidelines, it is worth basing that decision on what more than 100 economists are actually forecasting rather than what is trending in your feed.
Reach out to the MH Global team. Let’s look at what the data says about your specific market and figure out whether waiting is actually serving your goals.