
Record High Mortgage Debt Sounds Scary. Here’s What the Headlines Leave Out.
You may have seen the headlines about U.S. mortgage debt hitting an all-time high and felt a familiar sense of unease. Maybe someone brought it up as evidence that a housing crash is coming. The headline number is real. But it is only half the story, and the half that is missing changes everything.
Yes, Mortgage Debt Is at a Record High. Here Is the Context That Matters.
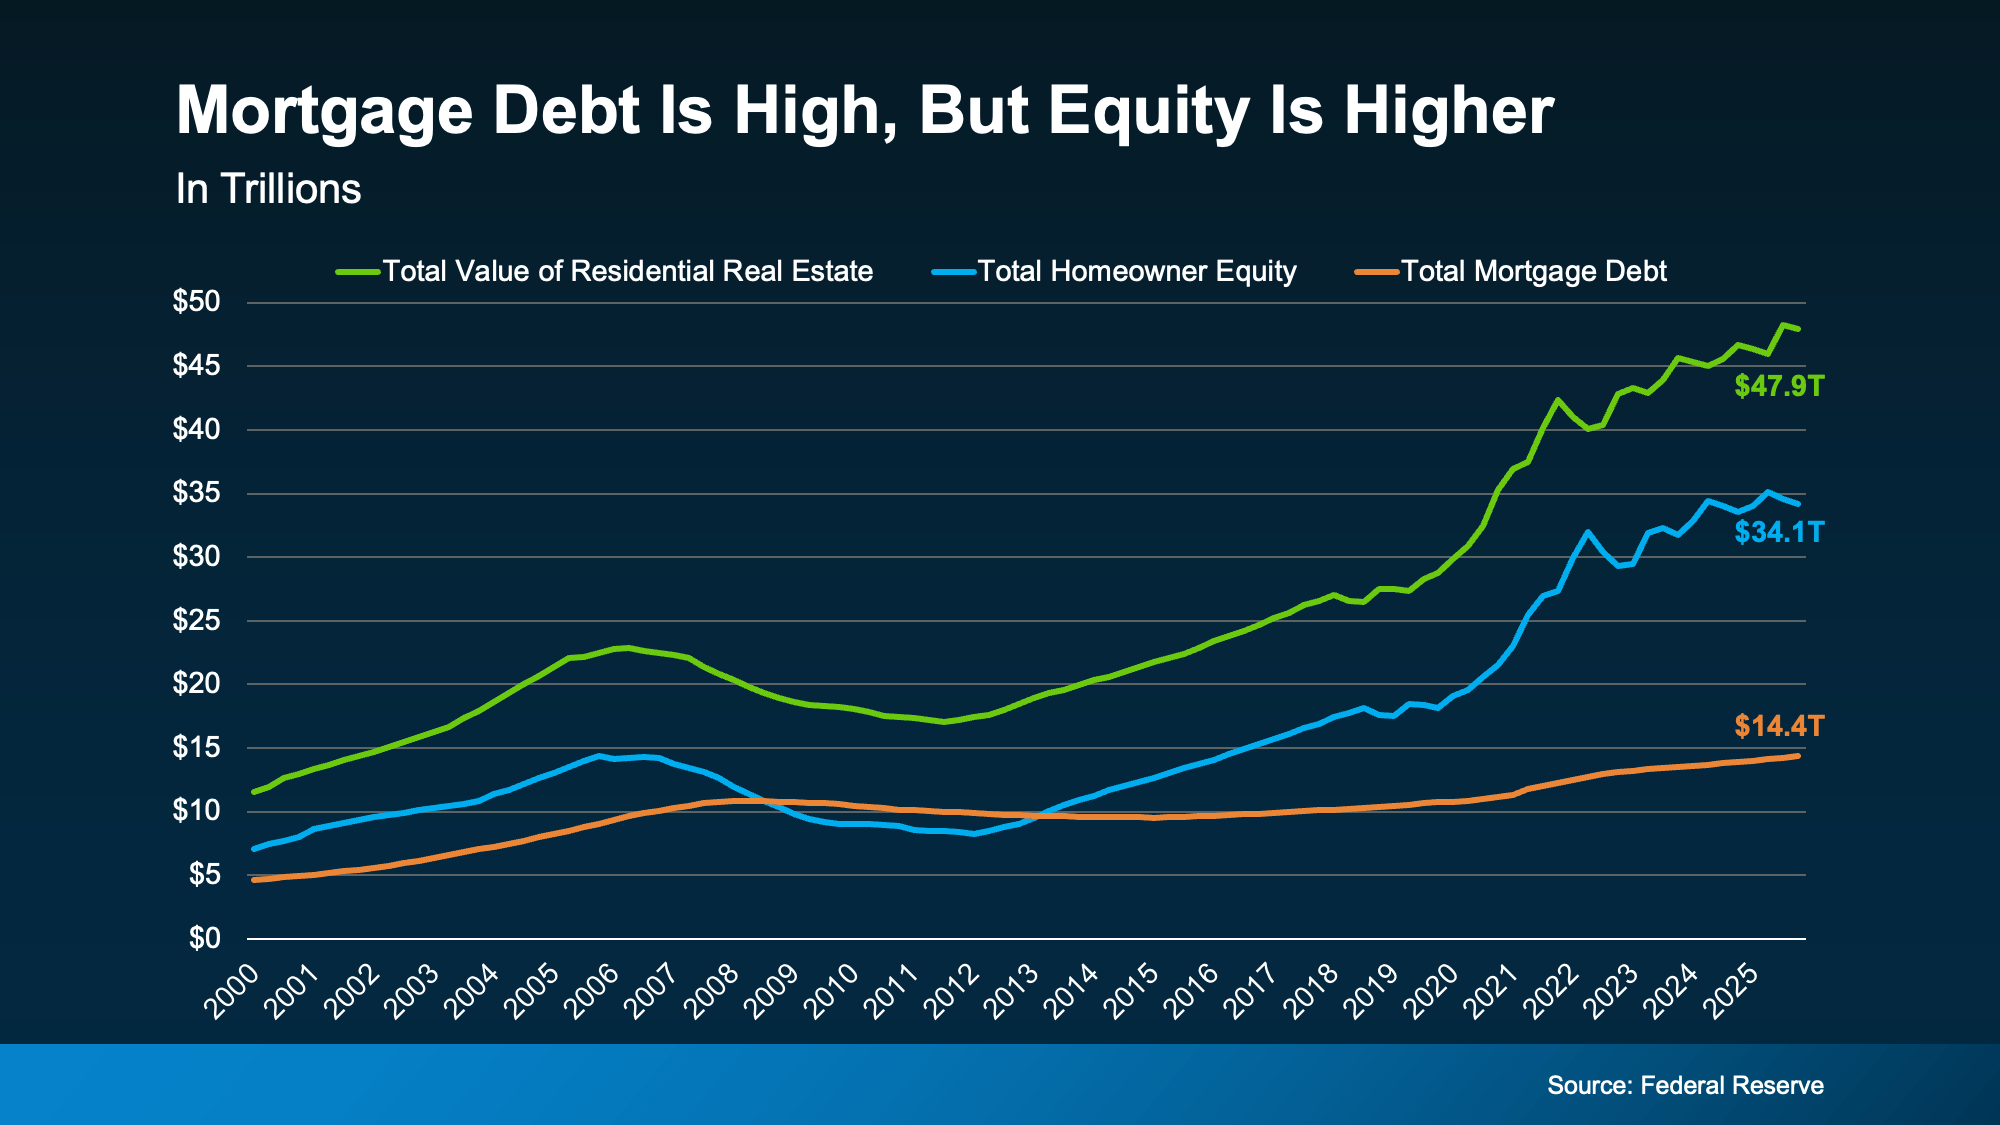
According to Federal Reserve data, total mortgage debt in the United States currently sits at approximately $14.4 trillion. That is an all-time high, and it sounds alarming when presented on its own.
But the Federal Reserve tracks something else alongside that number: the total value of all U.S. homes and the equity homeowners hold in those homes. Right now, total home values sit at approximately $47.9 trillion. Homeowner equity, the portion owners actually own free and clear, sits at approximately $34.1 trillion.
Let that sink in. Debt is at a record high. But equity is more than double the debt and is also near a record high. The assets dwarf the liabilities by a factor that makes the headline number look very different in context.
The Chart That Changes the Whole Story
The Federal Reserve data tracks three lines from 2000 to today: total home values, homeowner equity, and total mortgage debt. Look at the years between 2008 and 2013 and you will see exactly what a genuine housing crisis looks like. During that period the debt line crossed above the equity line, meaning millions of homeowners owed more than their homes were worth. They had no cushion. Selling was not an option. Foreclosure was often the only door available.
Today the picture is the exact opposite. The gap between what people owe and what they own has never been wider, in a favorable direction. Debt is high but equity is far higher. That structural difference is what separates a headline from a crisis.
This Is the Opposite of 2008. Here Is Why.
The reason 2008 became a crisis was not simply that debt was high. It was that home values collapsed below what was owed on them, leaving millions of homeowners underwater with no way out. Selling was not an option because the homes were worth less than the mortgages. That condition does not exist today.
The average homeowner is sitting on approximately $295,000 in home equity according to Cotality. If a homeowner runs into financial difficulty today, they have options that 2008 homeowners did not. They can sell, pay off what they owe, protect their credit, and in many cases walk away with money in hand. That safety valve is what prevents debt levels from spiraling into a crisis. For more on why today’s foreclosure picture looks nothing like 2008, our post What the Foreclosure Headlines Aren’t Telling You walks through the data in detail.
Most Homeowners Are in a Rock-Solid Position
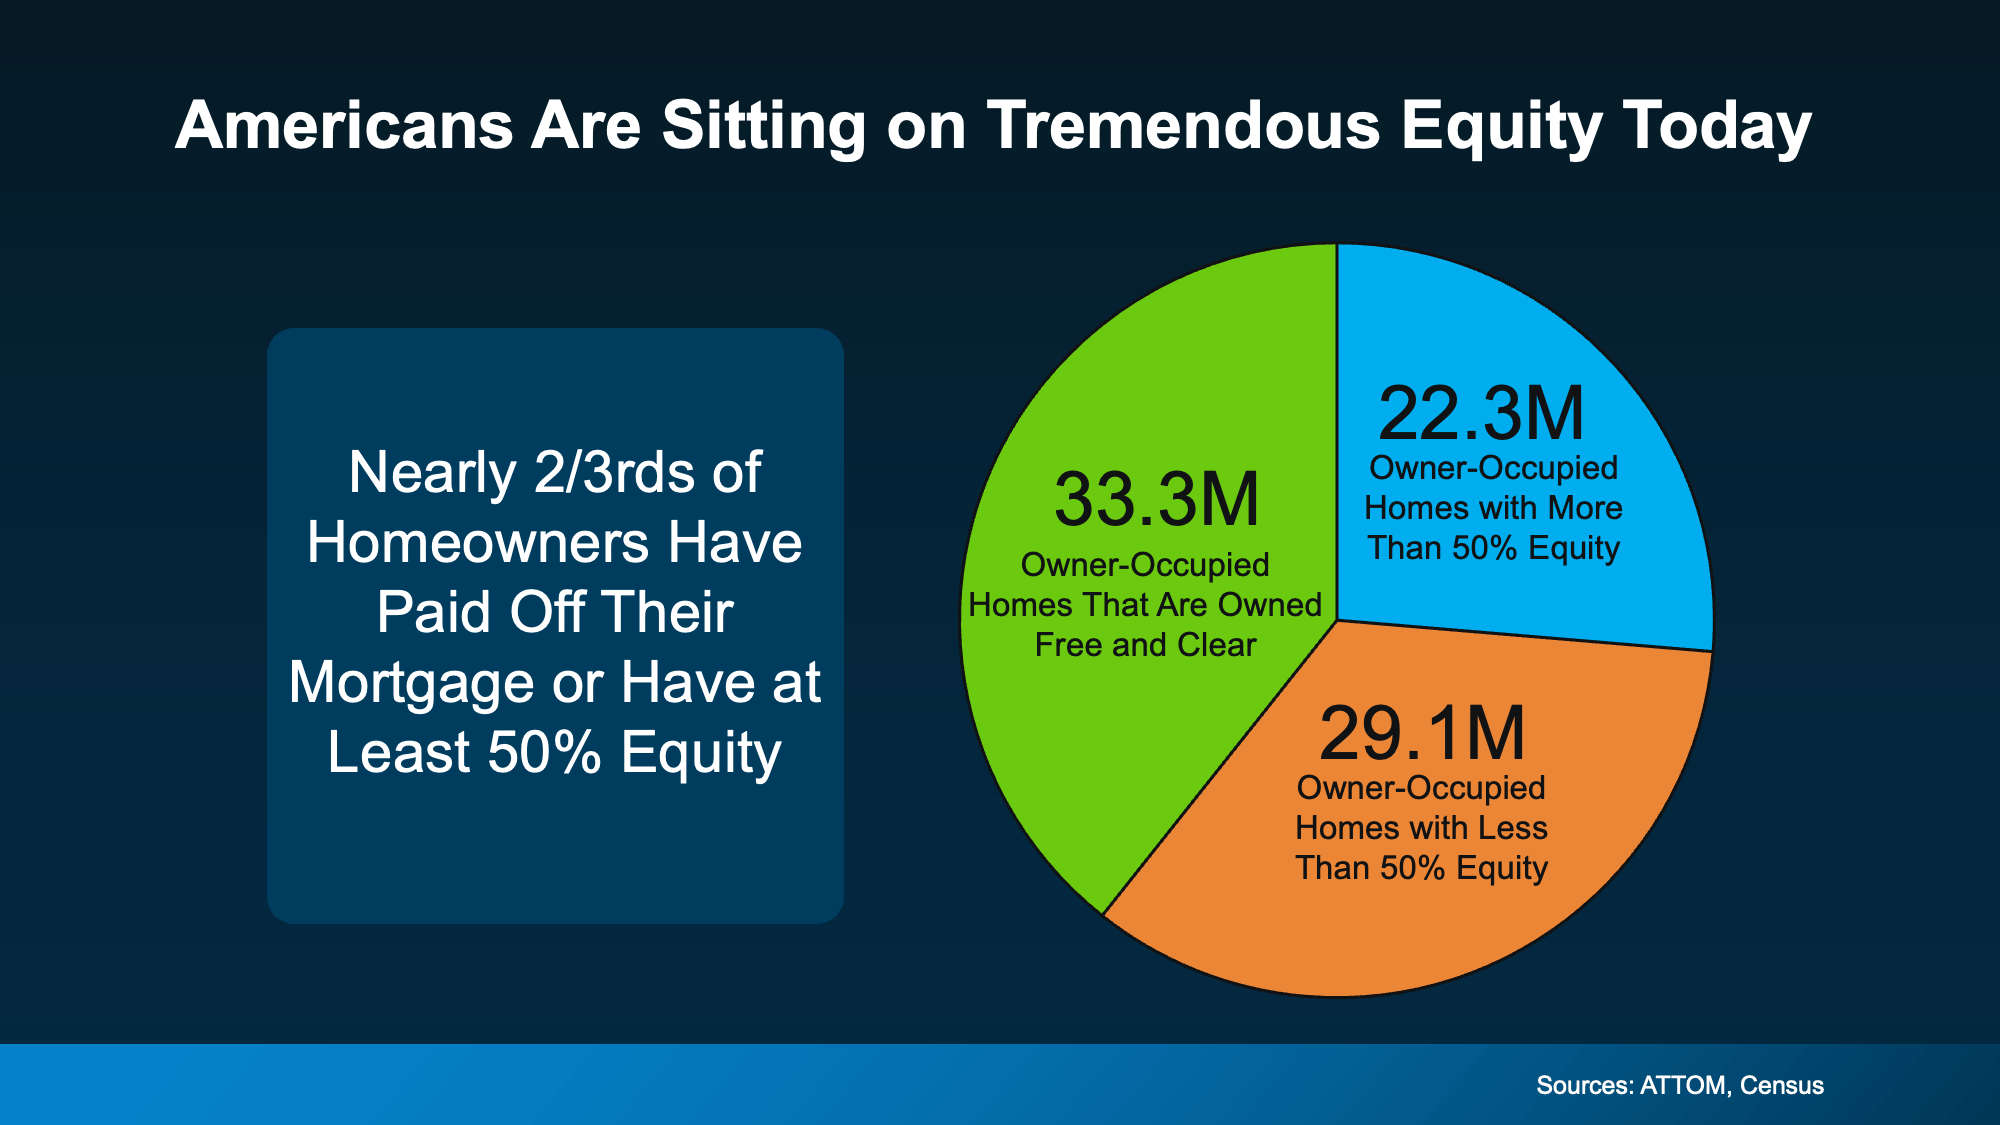
The national equity picture is compelling on its own. But what does it look like at the individual homeowner level? Data from ATTOM’s Q1 2026 Home Equity and Underwater Report combined with U.S. Census Bureau housing datatells the full story.
Out of all owner-occupied homes in the country, 33.3 million are owned completely free and clear with no mortgage, no lender, and no foreclosure risk whatsoever. Another 22.3 million homeowners have more than 50% equity in their homes. Add those together and you are looking at nearly two-thirds of all homeowners who have either paid off their mortgage entirely or hold such a substantial equity stake that they are in an extremely stable financial position.
The remaining 29.1 million homes with less than 50% equity are not a distress signal either. That group includes people who recently purchased and are building equity over time in perfectly healthy financial situations. This is not a market teetering on the edge. It is a market built on an unusually strong foundation.
Lending Standards Are Fundamentally Different Now
Before 2008, lenders approved mortgages with little to no verification of income or ability to repay. Adjustable-rate mortgages with teaser rates were issued broadly to buyers who could not sustain payments once rates adjusted. That system created the conditions for mass default.
Today, lending standards are significantly stricter. Borrowers must demonstrate the ability to repay, income is verified, and lenders evaluate whether buyers can handle payment changes. The loan pool today is fundamentally healthier than it was before the last crash. For buyers considering ARMs specifically in today’s environment, our post Thinking About an Adjustable-Rate Mortgage? Here’s What You Need To Know explains how today’s ARMs differ from the ones that caused problems before.
What Strong Equity Means for the Market Overall
High equity levels do more than protect individual homeowners. They stabilize the entire market. When homeowners have equity they have choices. They can sell rather than default. They can refinance. They can weather a period of financial difficulty without losing their home. That flexibility keeps distressed inventory off the market and prevents the kind of price collapse that only happens when forced selling floods the market at once.
This is also a key reason why home prices are holding steady despite a slower sales environment, which we covered in Are Home Prices Going To Fall? Sellers with equity simply do not need to slash prices to move their homes. For the full picture of what current market conditions mean for buyers and sellers right now, our Mid-Year Housing Market Reality Check covers everything you need to know.
What This Means for Buyers and Sellers in South Jersey
The equity story is not just national. South Jersey homeowners have benefited from consistent price appreciation over the past several years. According to Zillow, Camden County home values are up 4.9% over the past year, meaning local homeowners have continued building equity even as the broader market has moderated. For sellers wondering whether their financial position is strong enough to make a move, the answer in most cases is yes. For buyers wondering whether they are walking into a market that could collapse beneath them, the data says no.
If you are trying to make sense of what the current market means for your specific situation, our South Jersey Real Estate Market Update 2026 gives you the local picture. And if you are weighing whether to buy or continue renting given everything happening right now, Rent or Buy? The Real Tradeoff Most People Don’t Talk About lays out the long-term financial comparison clearly.
Record mortgage debt makes for a scary headline. But context matters. Equity is near an all-time high, home values have held firm, and the vast majority of homeowners are sitting on a level of financial strength that simply did not exist in 2008. The conditions that made that era a crisis are not present today.
Reach out to the MH Global team. Whether you are buying, selling, or simply trying to understand what the current market means for your situation, we will give you a straight answer based on real data.