The Housing Market Is Holding Up Better Than the Headlines Are Telling You
Turn on the news and the housing market sounds like it’s falling apart. High rates. Stretched budgets. Doom-and-gloom predictions scrolling across every feed. But when you look at what the data actually shows, a very different picture emerges. This market is not broken. It is not on the verge of collapse. In fact, by almost every meaningful historical measure, it is holding up remarkably well.
Stop Comparing Today to the Unicorn Years
The reason so much commentary sounds so negative is that most people are comparing today’s market to 2020 and 2021, which is the wrong comparison entirely. Those years were a once-in-a-generation anomaly driven by historic low mortgage rates, pandemic-era demand, and a combination of factors that had never existed before and will likely never exist again simultaneously. Bidding wars on everything, homes going under contract in 48 hours, buyers waiving inspections just to compete. That was not a normal market. It was a statistical outlier.
Compared to virtually any other period in modern real estate history, today’s market is functioning well. The framing problem is not the market. It is the benchmark people are using to evaluate it.
Homeowners Are Sitting on Unprecedented Financial Strength
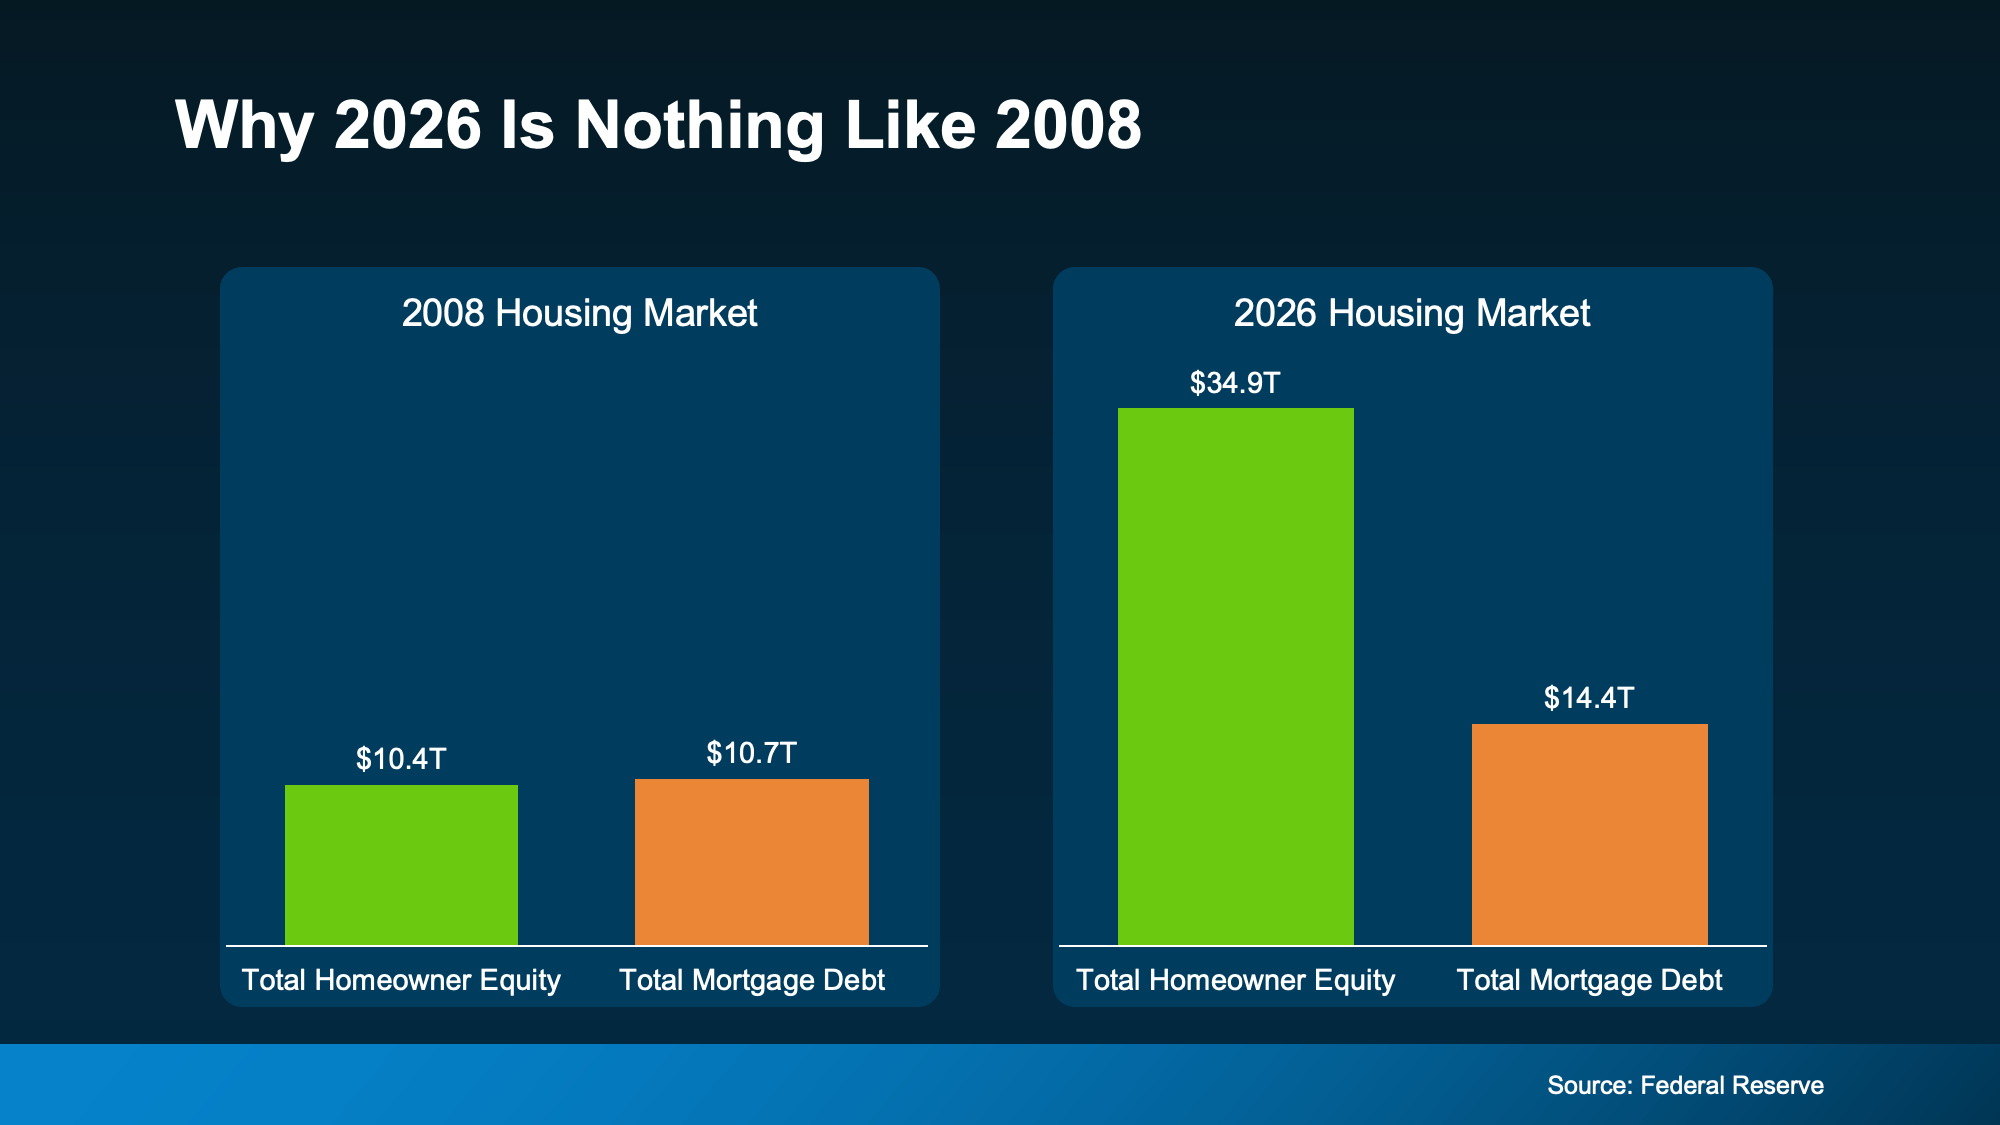
The single most important fact about today’s housing market is the financial position of the people in it. According to Federal Reserve data, total homeowner equity across the country now stands at approximately $35 trillion. To understand why that number matters, compare it to 2008, when homeowner equity and mortgage debt were nearly identical. That near-zero cushion is what made the last crash so devastating. When values fell, millions of owners had no buffer, no options, and no way out except foreclosure.
Today the gap between what people own and what they owe has never been wider. That gap gives homeowners choices. If someone hits a rough patch financially, most can sell, pay off what they owe, and walk away with money in hand. That safety valve is what prevents financial distress from cascading into market-wide collapse.
The Equity Picture at the Individual Level
The national equity total is compelling. The individual homeowner picture makes it concrete. According to Realtor.com research, homeowners who have been in their home for just five years have built up around $180,000 in equity on average. Stay six to ten years and that figure jumps to over $340,000.
Zoom out further and ATTOM’s Q1 2026 data combined with U.S. Census Bureau figures shows two-thirds of all homeowners either own their home outright with no mortgage at all or have more than 50% equity. That is not a fragile market sitting on thin ice. That is a population of homeowners who are financially positioned to make their next move from strength rather than pressure.
We covered the full debt and equity picture in detail in Record High Mortgage Debt Sounds Scary. Here’s What the Headlines Leave Out, and the foreclosure picture in What the Foreclosure Headlines Aren’t Telling You. The conclusion across both is the same: this is not 2008 and the structural conditions for a 2008-style crisis simply do not exist today.
Low Locked-In Rates Are Keeping Supply Tight
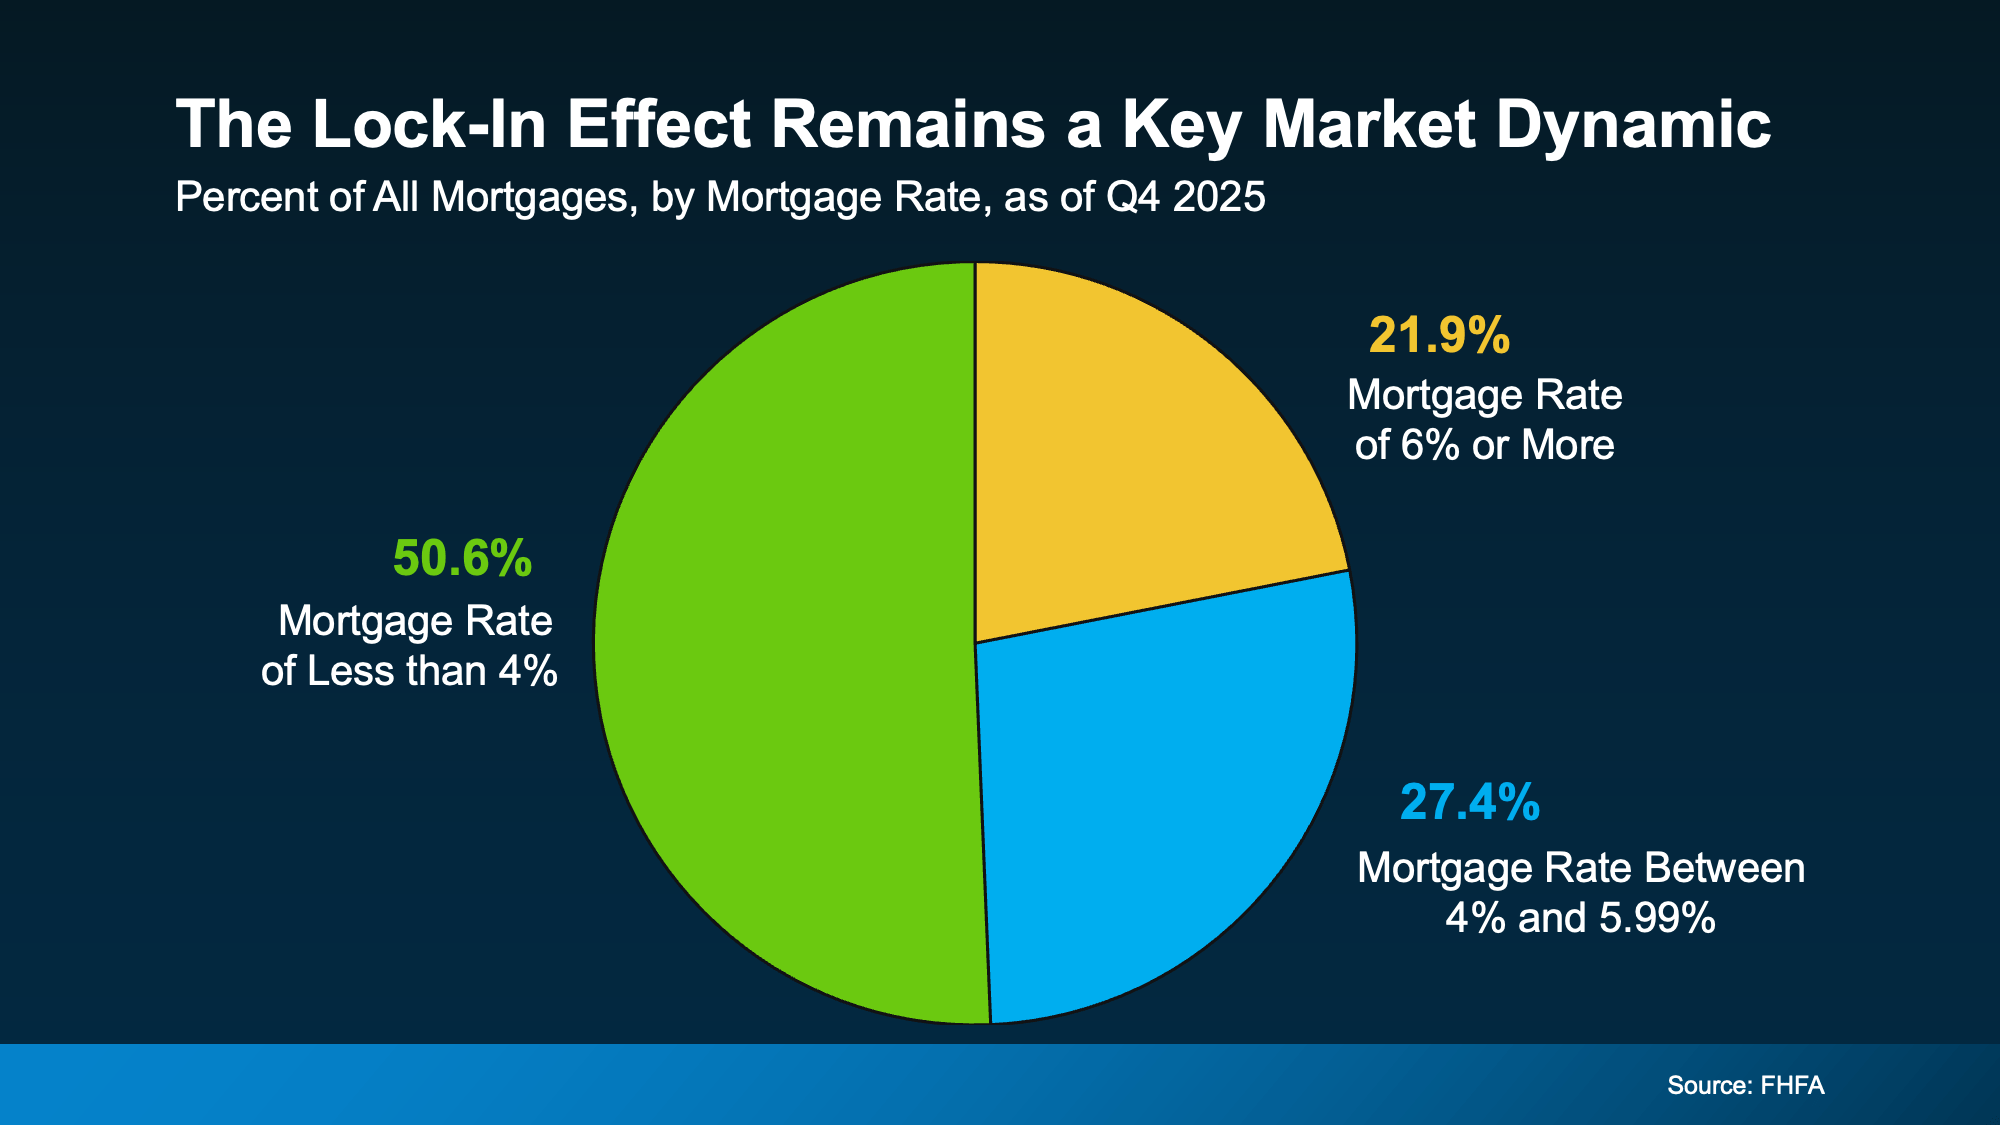
Here is the other major force shaping today’s market. According to FHFA National Mortgage Database data, more than half of all active mortgages in the country still carry a rate below 4%. Those homeowners are not eager to give up their rate and trade into the current environment. So they are staying put, keeping their homes off the market, and keeping supply constrained.
This is the primary driver of the tight inventory picture we have been covering all year. As we detailed in More Options Are Popping Up This Spring, inventory has been improving, but it is still below pre-pandemic norms in most Northeast markets including ours precisely because of this rate-lock dynamic. That constrained supply is also a key reason prices are not falling broadly even in a slower sales environment.
Foreclosure Volumes Remain Far Below Historical Norms
Despite the uptick in foreclosure filings that gets occasional headline coverage, ATTOM’s May 2026 Foreclosure Market Report confirms that volumes remain dramatically below historical norms. The owners who have equity have options that prevent financial difficulty from becoming foreclosure in the vast majority of cases. That dynamic was not present in 2008 and its absence now is one of the clearest signals that this is a different situation entirely.
Prices Are Moderating, Not Crashing
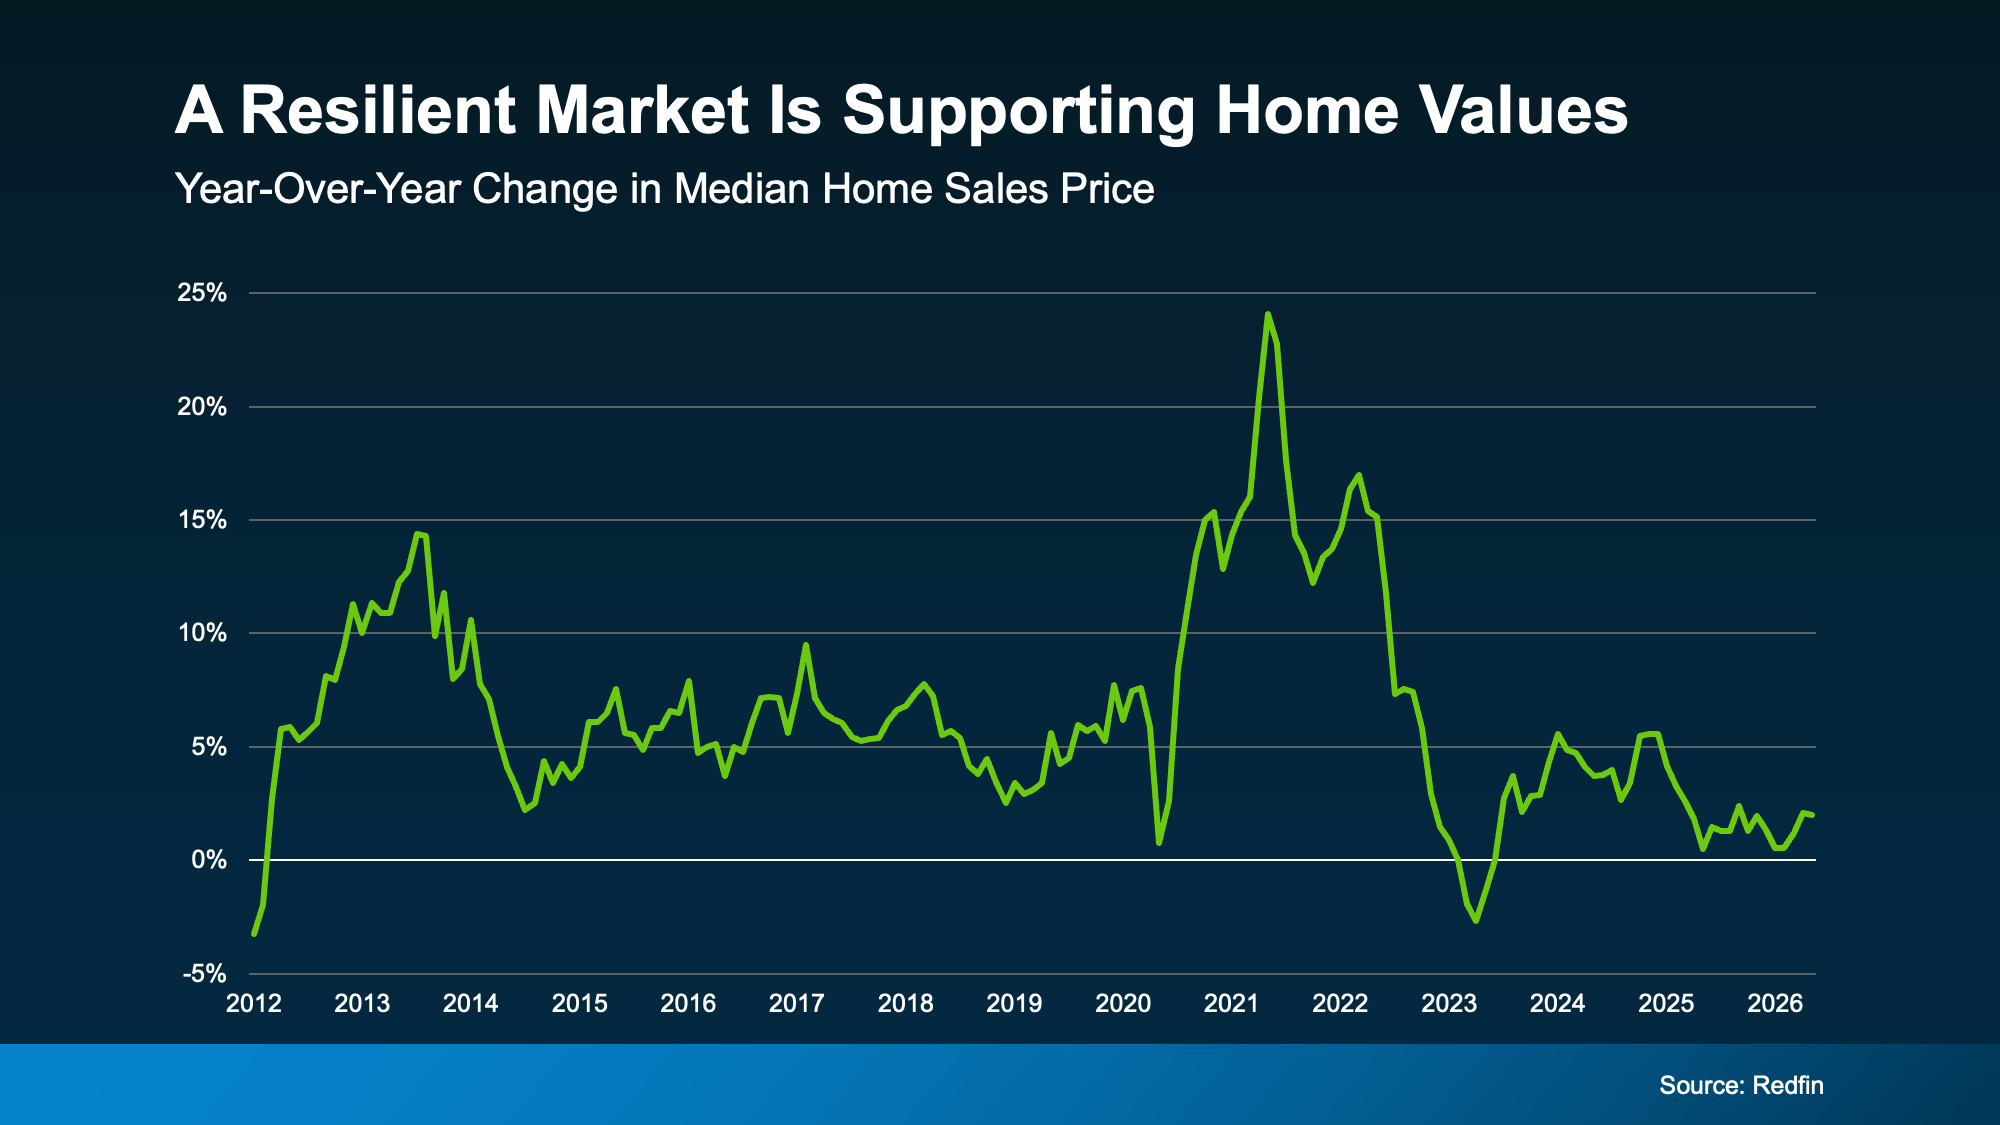
The pace of price growth has slowed. That is real and worth saying plainly. Redfin data shows prices still rising, but closer to 2% nationally year-over-year rather than the 15 to 20% pandemic-era pace. As Daryl Fairweather, Chief Economist at Redfin, put it: the market is in the middle of a long-term correction, not a crash. After the pandemic-era frenzy sent prices soaring and inventory to historic lows, the market needed a reset. A reset and a crash are not the same thing.
For buyers worried about purchasing before prices fall further, the professional consensus on where prices are actually headed is covered in Will Home Prices Crash? Here Is What the Data Actually Shows. The short version: even the most pessimistic forecasters expect prices to rise, not fall, over the next five years.
The Cost of Waiting Is Real
Here is the part that rarely gets discussed honestly. Sitting on the sidelines while you wait for a crash that isn’t in the data has a measurable cost. Every month you wait is a month someone else is building equity, locking in today’s price, and getting ahead of what most experts expect to be a housing surge once broader economic conditions settle. If the professional forecasters are right and prices rise even modestly, the buyer who waited pays more for the same home and arrives with less buying power than the buyer who moved when conditions were right for their situation.
The question is not whether this market is perfect. It isn’t. The question is whether the risk of waiting is actually lower than the risk of buying. The data suggests it is not. For buyers still weighing that decision, Wondering If You Should Still Buy a Home Right Now? and The Real Reason Some People Are Still Moving Right Now both address that question directly.
What This Means Right Here in South Jersey
South Jersey reflects every positive structural element described above. Homeowner equity in our market is strong. Foreclosure activity is minimal. Inventory remains constrained relative to demand. And prices, while growing more slowly than during the peak years, are still appreciating. Our South Jersey Real Estate Market Update 2026 has the full county-by-county picture.
The doom and gloom is loud. The data is quieter. But it is more reliable, and it tells a story of a market that has absorbed significant headwinds and is still standing on solid ground.
Reach out to the MH Global team. Let’s look at what this market actually means for your specific situation and figure out what your best move looks like right now.